GHS Releases Covid-19 Statistical Graph Showing Infection Rate Curve
GHS says the country has reached the peak of the covid-19 infection rate curve
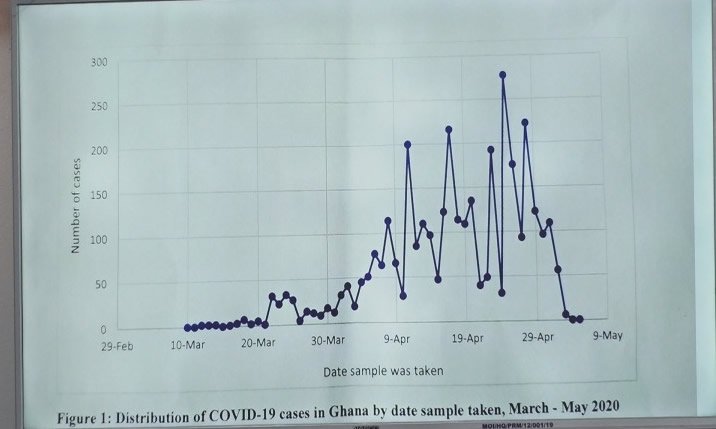
The Ghana Health Service (GHS) has released two graphs on the declining Covid-19 infection curve.
In explaining the presented data, the GHS says the country has reached its peak of Covid-19 infection and is likely to experience a continued decline in cases, if preventive care protocols are adhered to.
Some public health experts have however challenged the Service’s position when its Director of Public Health, Dr Badu Sakordie made the disclosure at a press briefing in Accra on Tuesday.
Ghana’s case count has now increased by 372 to 3,091. At the time the GHS announced Ghana had reached the peak of the curve, the country had 2,719.
READ ALSO:
Covid-19: Ghana’s Cases Reach 3,091, with 303 Recoveries

A pharmacist and a fellow the Centre for Democratic Development (CDD-Ghana) countered the claim.
Dr Kwame Asiedu Sarpong said the multiplicity of factors that impact the spread of the disease doesn’t support the assertion by the Ghana Health Service (GHS).
According to the Dr Sarpong Ghana is nowhere near its peak.
But at a press briefing on Thursday, the GHS defended its position and provided data to back it.
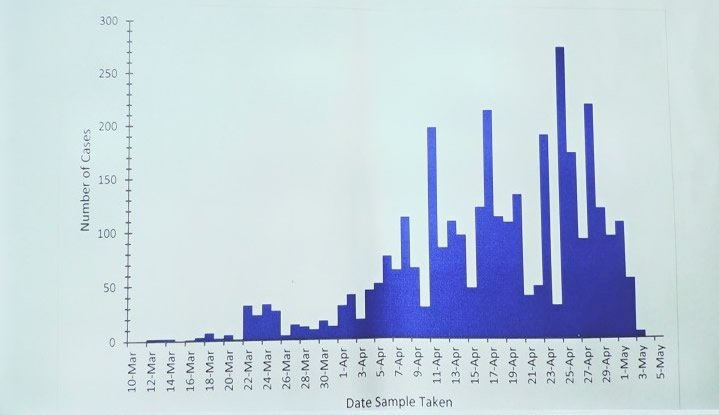
Director-General Dr Patrick Aboagye said, “we peaked around the 25 of April and since then the numbers have continued to come down until May 6.
“So that is showing that of the positivity, since peaking on April 2, we have consistently recorded a decline until today, May 7. “